jueves, 15 de noviembre de 2018

AUDIOMETER


It is a device which is used to perform audiometry tests where it allows to determine the auditory level of the patient in each of their ears. This consists of an integrated XR2206, 7 buttons to select the frequencies you want, three buttons for the selection of the dB of noise, an LCD for the display of the frequency and also the visualization of the three decibels obtained and finally two buttons to select the ear where you want to hear the sound.
When selecting the frequency, decibel and the ear where you want to listen to the sound depending on the frequency chosen, the sound will change sharply or record the decibels will lower or raise the noise intensity of that sound.

Functioning


To build an audiometer, we used a signal generator XR 2206 with the following configuration:

Figure 1,Signal generator configuration

With this configuration, we obtain a sine wave with different frequencies depending the resistors and capacitors values, with the following equation:  , setting the capacitor’s value C=100nf, we obtain the following resistor’s values for each frequency:

Each frequency had a voltage of 112mv, to change the decibels we used an operational amplifier LM358, calculating que out voltage necessary to get 5dB, 10dB and 15dB with the following equation: 
 
Replacing for each dB values:


Vout is the voltage necessary to obtain the audiometer sound in each dB values, for this reason, we amplify each vin to get that Vout using the operational amplifier shown in the following figure:
Figure 2,operational amplifier configuration

With the gain of the operational amplifier we obtain the Vout values with the following equation to calculate the resistor’s values:


Setting R1=1K

Them, in the audiometer designed, is possible choose the ear where do you want to listen the sound with a single switch, choosing the right or left earphone connection, as shown in the next figure:
Figure 3,earphone connection

Figure 4, Audiometer designed

Programming code:


The frequencies selection was shown in an Arduino interface with Arduino, using a 8 position dip switch to select the resistor to each frequency, when the voltage is 0 in each dip switch position, the Arduino recognize the frequency value, like in the following code:


RESULT 

As you can see below the result of the frequencies shown in the oscilloscope with the use of the resistors found the little lag that was obtained in each of these.

frequency of 125Hz


frequency of 250Hz


frequency of 500Hz


frequency of 1kHz


frequency of 2kHz


frequency of 4kHz


frequency of 8kHz


SPIROMETER


This equipment is used to measure the volume of air that the lungs can hold and the air flow velocity of inhalation and exhalation during respiration. It is composed of a flow sensor where one was located in the flexible tube and another in the lower part of the tube and an ultrasonic sensor located in the upper lid of the spirometer.

Programming code

The spirometer is composed by one intensive spirometer, an ultrasonic sensor and two flow sensors. The first step is measuring the distance of the ball into the spirometer, if we can measure the distance, we can calculate the inspired and expired volume.


Figure 1,spirometer
To measure the distance with ultrasonic sensor, we used the following code:
Figure 2,ultrasonic sensor programming code
The Arduino’s pin #7 is the trigger of the sensor and the 6th Arduino’s pin is the Echo, the ultrasonic sensor send a signal and when this signal detects an object, it comes back to the sensor in an specific time value, in the variable “duracion” is saved the time to detect the object and come back to the sensor and “distancia” is the distance in cm.
Each centimeter has 40 ml of air volume, for this reason, we made a linear regression with the distance VS volume:
Figure 3, linear regression distance vs volume
With the linear regression we can predict the volume with the distance’s value. To know the flow sensor sends an analog voltage, when the spiral is quiet, the voltage is 4.8 volts and when the spiral velocity is increasing, the voltage decreases until 2.4volts during a time value.
Figure 4,linear regression Voltage vs Flow

To count the time into the Arduino, was implemented the following code: 

Figure 5, programming code to get the time
RESULT

INSPIRE


EXHALE

CENTRIFUGE


is a machine that rotates a sample that separates components or phases of the sample by centrifugal force, it is composed of a rotor, a sample holder, an LCD screen and command control, where the emergency button and start button are located of the cycle on the other hand has a keyboard in which the RPM are entered and the time that the user wants it to last.
The LCD shows the RPM generated in the process of centrifugation and also gives warning that the lid is open, the rotor is off and the emergency stop, therefore are made by arduino programming alarms with line sensors explained later.

Programming code:

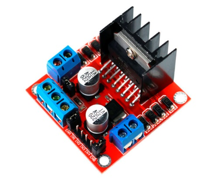
Figure 1,L298n module


It was used a L298N module to control motor velocity with the PWM Arduinos module. The L298n has three inputs, both of them are the motor direction called in1 and in2, one of the must be in a High level to move the motor, if the two inputs are on HIGH, the motor won´t move and we could cause a damage in in the module or the Arduino. The other INPUT is the Enable, it has the function to control the motor velocity with the PWM, with the Arduino’s function “analogWrite” we can send a pulse between 0 and 255, where 255 represent the highest velocity in the module and 0 is the lowest velocity. To send this pulse with the keypad, we have to make a linear regression between the bandwidth pulse and the rpm required, the first point is p1(90,1000) and the second point is p2(255,500) setting a minim rpm value of 1000rpm and a maximum of 5000 rpm.

Figure 2,linear regression


The main equation is represented in the last figure, but we want to predict send the pulse value to the module enable knowing the rpm’s values, for that reason, we calculate x in the equation:where numero is the rpm value and velocidad is the pulse value.


Figure 3,controling rpms


In this code, we activate one input of the module, and send the pulse with the function analogWrite in the third Arduino’s pin.

 To compare the rpms values are correct, we used a encoder that detects the rotor’s holes sending a pulse to the Arduino, the centrifuge rotor had 2 holes.

Figure 4, rpms code

When the encoder send a LOW level, it is indicating a hole, when it happens, a counter increases each 10 ms, to
Know the real value during the time configured, we used the next equation:
 
ALARM

Alarm for the lid

It is done with a line sensor located in a corner of the box where to find below cover this sends a 5 and performs the normal cycle of sample centrifugation, but to find the lid open sends a 0 to the arduino where q alert is displayed on the LCD EU cover is open and the centrifugation process stops until the lid is closed.As you can see in the next video:


Alarm for descalibrated rotor
The designed centrifuge allows to put two pairs if the rotor is decalibrated it can not initiate the centrifugation process since if the sample pair is not located in the sample holder it can not start the cycle therefore an alarm was made with the line sensors located on the side of the sample at the bottom.
If sensor1 is equal to LOW and sensor is equal to LOW or sensor1 it is equal HIGH and sensor2 equal to HIGH that performs all process for centrifugation, so that if sensor1 = LOW and sensor2 = HIGH it will not do anything until the rotor is 
calibrated .
As you can see in the next video:


Emergency stop

This was done with a button where if it was equal to LOW this could perform the normal centrifugation process, but if the user turned on the button it would stop the rotor stopping the sample holder, showing the EMERGENCY alert on the LCD until the student turned off said button.As you can see in the next video:


RESULT

As you can see as a result, the same RPM entered by the student were obtained where they were shown in LCD as you can see in the following picture:
figure 5. RPM