jueves, 15 de noviembre de 2018

AUDIOMETER


It is a device which is used to perform audiometry tests where it allows to determine the auditory level of the patient in each of their ears. This consists of an integrated XR2206, 7 buttons to select the frequencies you want, three buttons for the selection of the dB of noise, an LCD for the display of the frequency and also the visualization of the three decibels obtained and finally two buttons to select the ear where you want to hear the sound.
When selecting the frequency, decibel and the ear where you want to listen to the sound depending on the frequency chosen, the sound will change sharply or record the decibels will lower or raise the noise intensity of that sound.

Functioning


To build an audiometer, we used a signal generator XR 2206 with the following configuration:

Figure 1,Signal generator configuration

With this configuration, we obtain a sine wave with different frequencies depending the resistors and capacitors values, with the following equation:  , setting the capacitor’s value C=100nf, we obtain the following resistor’s values for each frequency:

Each frequency had a voltage of 112mv, to change the decibels we used an operational amplifier LM358, calculating que out voltage necessary to get 5dB, 10dB and 15dB with the following equation: 
 
Replacing for each dB values:


Vout is the voltage necessary to obtain the audiometer sound in each dB values, for this reason, we amplify each vin to get that Vout using the operational amplifier shown in the following figure:
Figure 2,operational amplifier configuration

With the gain of the operational amplifier we obtain the Vout values with the following equation to calculate the resistor’s values:


Setting R1=1K

Them, in the audiometer designed, is possible choose the ear where do you want to listen the sound with a single switch, choosing the right or left earphone connection, as shown in the next figure:
Figure 3,earphone connection

Figure 4, Audiometer designed
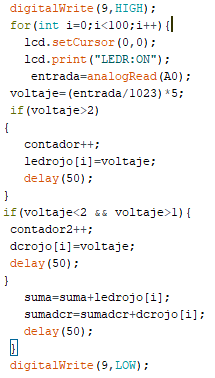
Programming code:


The frequencies selection was shown in an Arduino interface with Arduino, using a 8 position dip switch to select the resistor to each frequency, when the voltage is 0 in each dip switch position, the Arduino recognize the frequency value, like in the following code:


RESULT 

As you can see below the result of the frequencies shown in the oscilloscope with the use of the resistors found the little lag that was obtained in each of these.

frequency of 125Hz


frequency of 250Hz


frequency of 500Hz


frequency of 1kHz


frequency of 2kHz


frequency of 4kHz


frequency of 8kHz


SPIROMETER


This equipment is used to measure the volume of air that the lungs can hold and the air flow velocity of inhalation and exhalation during respiration. It is composed of a flow sensor where one was located in the flexible tube and another in the lower part of the tube and an ultrasonic sensor located in the upper lid of the spirometer.

Programming code

The spirometer is composed by one intensive spirometer, an ultrasonic sensor and two flow sensors. The first step is measuring the distance of the ball into the spirometer, if we can measure the distance, we can calculate the inspired and expired volume.


Figure 1,spirometer
To measure the distance with ultrasonic sensor, we used the following code:
Figure 2,ultrasonic sensor programming code
The Arduino’s pin #7 is the trigger of the sensor and the 6th Arduino’s pin is the Echo, the ultrasonic sensor send a signal and when this signal detects an object, it comes back to the sensor in an specific time value, in the variable “duracion” is saved the time to detect the object and come back to the sensor and “distancia” is the distance in cm.
Each centimeter has 40 ml of air volume, for this reason, we made a linear regression with the distance VS volume:
Figure 3, linear regression distance vs volume
With the linear regression we can predict the volume with the distance’s value. To know the flow sensor sends an analog voltage, when the spiral is quiet, the voltage is 4.8 volts and when the spiral velocity is increasing, the voltage decreases until 2.4volts during a time value.
Figure 4,linear regression Voltage vs Flow

To count the time into the Arduino, was implemented the following code: 

Figure 5, programming code to get the time
RESULT

INSPIRE


EXHALE

CENTRIFUGE


is a machine that rotates a sample that separates components or phases of the sample by centrifugal force, it is composed of a rotor, a sample holder, an LCD screen and command control, where the emergency button and start button are located of the cycle on the other hand has a keyboard in which the RPM are entered and the time that the user wants it to last.
The LCD shows the RPM generated in the process of centrifugation and also gives warning that the lid is open, the rotor is off and the emergency stop, therefore are made by arduino programming alarms with line sensors explained later.

Programming code:

Figure 1,L298n module


It was used a L298N module to control motor velocity with the PWM Arduinos module. The L298n has three inputs, both of them are the motor direction called in1 and in2, one of the must be in a High level to move the motor, if the two inputs are on HIGH, the motor won´t move and we could cause a damage in in the module or the Arduino. The other INPUT is the Enable, it has the function to control the motor velocity with the PWM, with the Arduino’s function “analogWrite” we can send a pulse between 0 and 255, where 255 represent the highest velocity in the module and 0 is the lowest velocity. To send this pulse with the keypad, we have to make a linear regression between the bandwidth pulse and the rpm required, the first point is p1(90,1000) and the second point is p2(255,500) setting a minim rpm value of 1000rpm and a maximum of 5000 rpm.

Figure 2,linear regression


The main equation is represented in the last figure, but we want to predict send the pulse value to the module enable knowing the rpm’s values, for that reason, we calculate x in the equation:where numero is the rpm value and velocidad is the pulse value.


Figure 3,controling rpms


In this code, we activate one input of the module, and send the pulse with the function analogWrite in the third Arduino’s pin.

 To compare the rpms values are correct, we used a encoder that detects the rotor’s holes sending a pulse to the Arduino, the centrifuge rotor had 2 holes.

Figure 4, rpms code

When the encoder send a LOW level, it is indicating a hole, when it happens, a counter increases each 10 ms, to
Know the real value during the time configured, we used the next equation:
 
ALARM

Alarm for the lid

It is done with a line sensor located in a corner of the box where to find below cover this sends a 5 and performs the normal cycle of sample centrifugation, but to find the lid open sends a 0 to the arduino where q alert is displayed on the LCD EU cover is open and the centrifugation process stops until the lid is closed.As you can see in the next video:


Alarm for descalibrated rotor
The designed centrifuge allows to put two pairs if the rotor is decalibrated it can not initiate the centrifugation process since if the sample pair is not located in the sample holder it can not start the cycle therefore an alarm was made with the line sensors located on the side of the sample at the bottom.
If sensor1 is equal to LOW and sensor is equal to LOW or sensor1 it is equal HIGH and sensor2 equal to HIGH that performs all process for centrifugation, so that if sensor1 = LOW and sensor2 = HIGH it will not do anything until the rotor is 
calibrated .
As you can see in the next video:


Emergency stop

This was done with a button where if it was equal to LOW this could perform the normal centrifugation process, but if the user turned on the button it would stop the rotor stopping the sample holder, showing the EMERGENCY alert on the LCD until the student turned off said button.As you can see in the next video:


RESULT

As you can see as a result, the same RPM entered by the student were obtained where they were shown in LCD as you can see in the following picture:
figure 5. RPM


martes, 16 de octubre de 2018

BLOOD PRESSURE MONITOR

This equipment allows the measurement of blood pressure and consists of a cuff, a compressor that allows pumping air to the cuff, a gauge that allows us to measure pressure entered at the cuff, a sensor system. The sphygmomanometer takes two systolic values, when the heart pumps blood and diastolic when the heart is at rest where the normal range is 120 - 80mmHg. For the systolic and diastolic value decision cuff should block the blood pass where you stop breathing until the 300mmHg, subsequently is desinsufla and at the moment that the pointer on the gauge starts scrolling the first time and this is the systolic and diastolic range when the last time.

The monitor works through the oscillometric method where it insufflates the cuff through the compressor until 400mmHg by opening the valve is desinsufla slowly taking first vibration which will be the systolic value where the gauge needle will continue to vibrating thus showing the heart rate and the diastolic value being the last vibration taken before opening the valve and that the cuff desinsufle completely.
http://www.tensoval.es/aparatos-de-medicion-oscilometrica.php

The compressor is powered with 110v which is connected to the first relay and the valve connected to the second 12V relay these are set to send the arduino 5v, when you turn on the compressor and the valve had damage on the LCD for this was mounted on a stage of power control so the current when the engine does not cause damage to the circuit; designed with an optocoupler 4N26 in order to perform an optical coupling of power and isolation of land, a tip 122 and a 2N2222 transistor used to amplify the current sent by the arduino.The second stage of the mpx 5100 sensor

power  control scheme

MPX-5100 pressure sensor.


In this blood pressure monitor was used a MPX5100 sensor. This sensor makes a comparison between the bracelet and the atmospheric pressure, the pressure makes a voltage difference when its increasing or decreasing, with a linear regression. When the bracelet pressure is approximately 0 mmHg, the sensor has 0.18 volts and when the pressure is 140mmHg the sensor´s voltages is 1v. With this information, its possible predict the other pressure values along the functioning of the blood pressure monitor with a linear regression. The first step is to know the slope´s value with the following equation:

The first point is P1(0.18,0) and the second point is P2(1,140), where the first value in the point is the voltage (volts) and the second is the pressure(mmHg), replacing in the equation, slope´s value is 170.73, indicating the change between the voltage and the pressure. The following step is calculate the main regression with the equation:


Y Is the value to know and x is the sensor´s output voltage while y1 and x1 are the points values, replacing: 

we obtain the finally result:


Programming code.


The blood pressure monitor functioning is composed by three stage: the first stage is bracelet insufflating, second bracelet desinsufflating and the third the information visualization.

bracelet insufflating


To turn on the air pump and the electrical valve must be opened, with a push button the Arduino’s pin is in a high state and begins to insufflate the bracelet until the pressure in the system is lower than 140mmHg, with the following code:


bracelet desinsufflating


when the pressure is 140mmHg, the air pump is turned off, but the electrical valve continues turned on, throwing out the air slowly. When the air is throwing out, the manometer begins to vibrate giving us the systolic pressure value, to get this value in our system, when the decreasing values are greater than the last value, we detect a manometer vibration, the maximum value saved in an array, is the systolic pressure and the minimum value in that array corresponds to the diastolic pressure. When the two pressure values are taken, the electrical valve is turned off and the bracelet comes back to 0mmHg. Each time that the manometer needle vibrates, we detect the heart rate, with a counter during the bracelet desinsufflating. In the next figure, is the code implemented:


Figure 1, Sistolic pressure


Figure 2, Diastolic pressure

Alarm

Generated a conditional if maximum value was greater than 125 or greater than 90 minimum patient had high blood pressure and if the maximum value was less 115 or minimum value was less than 75 presented hypotension as shown below, where it was shown on the LCD.
alarm
Result


martes, 25 de septiembre de 2018

PULSE OXIMETRY


Obtaining Oximetry Signal


To obtain oximetry signal, its necessary use two photodiodes, the first is an infrared diode and the second diode is a Red led. The Oximetry measures the relationship between oxygenated hemoglobin and desoxygenated hemoglobin with a diferent absortion spectrum, for the desoxygenated hemoglobin is already 920nm-950nm fot that reason can be detected by the infrared diode and the oxygenated hemoglobin is 600nm-650nm, detected by the red led that is in 660nm. To receive the signal through the finger is used a photoreceptor detecting changes in wave length.


Resultado de imagen para pulsioximetria funcionamiento
Figure 1, Oximetry Functioning , picture taken from: https://comprarpulsioximetro.com/como-funciona-un-pulsioximetro/

Transimpedance Amplifier


When the photodiodes emit infrared and red light through the finger, there is a change in the wavelength  and in the current in the cuircuit, but to create a control of the variable, its necessary convert that current to a voltage value with a transimpedance amplifier like in the following figure: 

Figure2, Transimpedance amplifier 

In this case, the gain of the amplifier is Gain=1000 because the original signal is in the mv order, and in the microcontroller need a higher voltage than milivolts, calculated with the equation  Taking on R1 resistance of 1KΩ clearing of the equation  and replacing the gain and the R1 results 

Band-pass filter: 

The frequency spectrum for the oximetry is between 0.016Hz and 3Hz,to delete all the noise from another frequencies, a band-pass filter composed by a low pass filter and a high pass filter.

  • High Pass filter: The pass filter is built with a center frequency of 0.15Hz, allowing the pass of all frequencies above this value. The folloving equation describes RC values according to the center frequency: where fc is the chosen frequency, R is the resistor's value and C is the capacitor's value, in this case C=1μf replacing in the equation, looking for the resistor´s value we that  1.061MΩ
  • Figure 3, High Pass Filter

  • Low Pass filter: The low pass filter is built with a center frequency of 10Hz stopping all the frequencies above this value, and allowing all the frequencies under the value. The math operations to know the resistor's value is the same with a capacitor's commercial value of C=1μf,  =15kΩ.
    Figure 4, Low Pass filter


Heart Rate 

The infrared diode detects the desoxygenated hemoglobin,is possible detect the heart rate because the heart pump oxygenated blood to all the body, if the infrared diode read a change of voltage when the blood arrives to the fingers,we could know when is a beat. To get that information was used a microcontroller (Arduino UNO), the out of the circuit is connected to the arduino´s ADC converter to read that voltage inside the microcontroller. The firt step is obtain the voltage in the arduino converting analog signal into a digiatl signal with the ADC converter, the bits resolution of the arduino uno is 10 bits (2^10) and the voltage referenceis Arduino's source (5v), in this way the digital voltage is:

The voltage is approximately 2.6v, reading this value we can create a counter ,each time that the voltage is greater than 2v the counter increase in 1 unit during fifteen seconds, to know the bets per minute, the counter´s value is multiplied by 4 (15s*4=60s) completing the data collection. the next figure shows the arduino´s code implemented:

Figure 5, Code implemented to get heart rate.


Oxygen Saturation (SPO2)

The light absortion emitted by the photodiodes is due to the skin, blood vessels and venous the arterial blood flow is pulsatile and the other fluids are constant,givin us 4 type of voltage  when the red led is turned on there are dc voltage(no pulsatile) and Ac voltage (pulsatile) and the same with the infrared led. to obtain oxygen saturation, the photodiodes were turned on with the Arduino´s digital pins during 5 seconds, first was activates the red Led detecting the changes of voltage between Dc and AC, if the voltages is greater than 2v, is an AC red led voltage and was saved into an array but if the voltages is lower than 2v is a DC red led voltage saved into another array. When the time is complete, was calculates a mean of the two arrays (DC and AC red led voltage).After that, the infrared diode was turned on during five seconds with the same process. 

Figure 6, Turning on Red LED


Figure 7, Turning on Infrared diode

when all the values are taken, the absortion coefficient R is calculated with the following equation:
                                                                               
 R's value allows know the oxygen saturation (SPO2) with a oxyhemmoglobin dissociation curve, shown in the next picture:
Figure 8, Oxyhemoglobine dissociation curve, tajen from: file:///C:/Users/chris/Downloads/P.A.%20Daneri-Electromedicina_%20Equipos%20de%20Diagn%C3%B3stico%20y%20Cuidados%20Intensivos-Hasa%20(2007)%20(1).pdf
To know the oxygen saturation,its necessary calculate the curve's slope with the equation :
                                                                                                                 
The first point p1 is (1,85) and the second point p2 (3.4,0), applying the equationand finally the regression  where y is the oxygen saturation value obtained with the implemented circuit, the regressioncalculated in this design is:


Alarm

To make the alarm was used a obstacle sensor, when there isn´t something close to the sensor, the sensor´s output is 5v but when it detects the presence of an object ,in this case finger,the sensor´s output is 0v.The Arduino's Digital pins Receive the logic voltage, while this voltage is HIGH (5v), in the LCD appears a message (locate finger), if the person locate finger , the voltage is 0 and it comes out of the while cycle.


Pulse oximetry schematic


Results

Commercial pulse oximeter V.S Designed pulse Oximeter 


Finger´s detection


Oxymetry Signal