Obtaining Oximetry Signal
To obtain oximetry signal, its necessary use two photodiodes, the first is an infrared diode and the second diode is a Red led. The Oximetry measures the relationship between oxygenated hemoglobin and desoxygenated hemoglobin with a diferent absortion spectrum, for the desoxygenated hemoglobin is already 920nm-950nm fot that reason can be detected by the infrared diode and the oxygenated hemoglobin is 600nm-650nm, detected by the red led that is in 660nm. To receive the signal through the finger is used a photoreceptor detecting changes in wave length.
 |
| Figure 1, Oximetry Functioning , picture taken from: https://comprarpulsioximetro.com/como-funciona-un-pulsioximetro/ |
Transimpedance Amplifier
When the photodiodes emit infrared and red light through the finger, there is a change in the wavelength and in the current in the cuircuit, but to create a control of the variable, its necessary convert that current to a voltage value with a transimpedance amplifier like in the following figure:
 |
| Figure2, Transimpedance amplifier |
In this case, the gain of the amplifier is Gain=1000 because the original signal is in the mv order, and in the microcontroller need a higher voltage than milivolts, calculated with the equation  Taking on R1 resistance of 1KΩ clearing of the equation
  and replacing the gain
and the R1 results
and replacing the gain
and the R1 results 
Taking on R1 resistance of 1KΩ clearing of the equation and replacing the gain
and the R1 results
Band-pass filter:
The frequency spectrum for the oximetry is between 0.016Hz and 3Hz,to delete all the noise from another frequencies, a band-pass filter composed by a low pass filter and a high pass filter.
- High Pass filter: The pass filter is built with a center frequency of 0.15Hz, allowing the pass of all frequencies above this value. The folloving equation describes RC values according to the center frequency:
 where fc is the chosen frequency, R is the resistor's value and C is the capacitor's value, in this case C=1μf replacing in the equation, looking for the resistor´s value we that
  1.061MΩ
-

Figure 3, High Pass Filter
-
Low Pass filter: The low pass filter is built with a center frequency of 10Hz stopping all the frequencies above this value, and allowing all the frequencies under the value. The math operations to know the resistor's value is the same with a capacitor's commercial value of C=1μf,
 =15kΩ.

Figure 4, Low Pass filter
where fc is the chosen frequency, R is the resistor's value and C is the capacitor's value, in this case C=1μf replacing in the equation, looking for the resistor´s value we that 1.061MΩ |
| Figure 3, High Pass Filter |
-
Low Pass filter: The low pass filter is built with a center frequency of 10Hz stopping all the frequencies above this value, and allowing all the frequencies under the value. The math operations to know the resistor's value is the same with a capacitor's commercial value of C=1μf, =15kΩ.
Figure 4, Low Pass filter
Low Pass filter: The low pass filter is built with a center frequency of 10Hz stopping all the frequencies above this value, and allowing all the frequencies under the value. The math operations to know the resistor's value is the same with a capacitor's commercial value of C=1μf, =15kΩ.
=15kΩ. |
| Figure 4, Low Pass filter |
Heart Rate
The infrared diode detects the desoxygenated hemoglobin,is possible detect the heart rate because the heart pump oxygenated blood to all the body, if the infrared diode read a change of voltage when the blood arrives to the fingers,we could know when is a beat. To get that information was used a microcontroller (Arduino UNO), the out of the circuit is connected to the arduino´s ADC converter to read that voltage inside the microcontroller. The firt step is obtain the voltage in the arduino converting analog signal into a digiatl signal with the ADC converter, the bits resolution of the arduino uno is 10 bits (2^10) and the voltage referenceis Arduino's source (5v), in this way the digital voltage is:

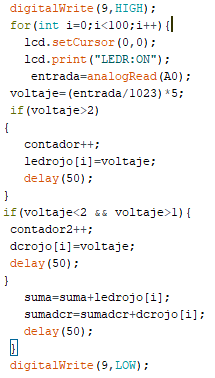
The voltage is approximately 2.6v, reading this value we can create a counter ,each time that the voltage is greater than 2v the counter increase in 1 unit during fifteen seconds, to know the bets per minute, the counter´s value is multiplied by 4 (15s*4=60s) completing the data collection. the next figure shows the arduino´s code implemented:
 |
| Figure 5, Code implemented to get heart rate. |
Oxygen Saturation (SPO2)
The light absortion emitted by the photodiodes is due to the skin, blood vessels and venous the arterial blood flow is pulsatile and the other fluids are constant,givin us 4 type of voltage when the red led is turned on there are dc voltage(no pulsatile) and Ac voltage (pulsatile) and the same with the infrared led. to obtain oxygen saturation, the photodiodes were turned on with the Arduino´s digital pins during 5 seconds, first was activates the red Led detecting the changes of voltage between Dc and AC, if the voltages is greater than 2v, is an AC red led voltage and was saved into an array but if the voltages is lower than 2v is a DC red led voltage saved into another array. When the time is complete, was calculates a mean of the two arrays (DC and AC red led voltage).After that, the infrared diode was turned on during five seconds with the same process.
 |
| Figure 6, Turning on Red LED |
 |
| Figure 7, Turning on Infrared diode |
when all the values are taken, the absortion coefficient R is calculated with the following equation:

R's value allows know the oxygen saturation (SPO2) with a oxyhemmoglobin dissociation curve, shown in the next picture:
 |
| Figure 8, Oxyhemoglobine dissociation curve, tajen from: file:///C:/Users/chris/Downloads/P.A.%20Daneri-Electromedicina_%20Equipos%20de%20Diagn%C3%B3stico%20y%20Cuidados%20Intensivos-Hasa%20(2007)%20(1).pdf |
To know the oxygen saturation,its necessary calculate the curve's slope with the equation :

The first point p1 is (1,85) and the second point p2 (3.4,0), applying the equation and finally the regression
  where y is the oxygen saturation value obtained with the implemented circuit, the regression
 calculated in this design is:
and finally the regression where y is the oxygen saturation value obtained with the implemented circuit, the regressioncalculated in this design is: |
To make the alarm was used a obstacle sensor, when there isn´t something close to the sensor, the sensor´s output is 5v but when it
detects the presence of an object ,in this case finger,the sensor´s output is 0v.The Arduino's Digital pins Receive the logic voltage, while this voltage is HIGH (5v), in the LCD appears a message (locate finger), if the
person locate finger , the voltage is 0 and it comes out of the while cycle.
Pulse oximetry schematic
Pulse oximetry schematic
 |
Commercial pulse oximeter V.S Designed pulse Oximeter
Finger´s detection
Oxymetry Signal


